
From January 2024 through June 2026, the AWALL research team analyzed data from over 14 primary market research reports, platform benchmark studies, and industry surveys to understand the key drivers, ROI benchmarks, and strategic trends shaping B2B video marketing. Sources include annual reports from Wyzowl,1 Vidyard,2 Wistia,3 the IAB,4 HubSpot,5 Campaign Monitor,6 LinkedIn, ON24, and Statista. This article compiles the most important findings across five dimensions: adoption rates and trends, performance and ROI benchmarks, video format usage and effectiveness, distribution channel performance, and budget and production trends.
B2B Video Marketing Adoption
Video has crossed from growth channel to baseline expectation. Adoption hit 91% in 20261, recovering from a two-year plateau at 89% and matching the all-time high first reached in 2023. The remaining 9% of non-adopters are concentrated primarily in sectors with regulatory constraints on visual content. For the vast majority of B2B marketing teams, the question is no longer whether to use video but how to use it more effectively than competitors running the same playbook.
B2B Video Marketing Statistics at a Glance: 2026
| Metric | 2024 | 2025 | 2026 |
|---|---|---|---|
| Businesses using video as a marketing tool | 89% | 89% | 91% |
| Video marketers considering video important to overall strategy | 88% | 95% | 93% |
| Video marketers reporting positive ROI | 88% | 93% | 82% |
| B2B marketers ranking video as highest-ROI content format | N/A | 52% | 49% (short-form) |
| B2B buyers using video during purchase process | N/A | 70% | 70% |
| Marketers planning to maintain or increase video spend | 85% | 92% | 92% |
| Video marketers using AI tools for creation or editing | 18% | 41% | 63% |
| Landing page conversion lift with embedded video | N/A | Up to 86% | Up to 86% |
| In-house video production share | ~75% | ~75% | ~75% |
| U.S. digital video ad spend | $54.7B | $64B | $72B (projected) |
Source note: Adoption and ROI from Wyzowl State of Video 2026 (n=266). B2B buyer data from Google/Vidyard, 2025. AI adoption from Wyzowl 2026 and Wistia 2025. Landing page conversion from EyeView/Hostinger, 2025. Ad spend from IAB, 2025.
Key Takeaways:
- Video adoption has returned to its all-time high of 91%, recovering from a dip to 89% in 2024-2025.
- Reported ROI dipped from a 2025 peak of 93% to 82% in 2026, the largest single-year drop in Wyzowl's 12-year tracking history.
- AI tool adoption in video production tripled in two years, moving from 18% in 2024 to 63% in 2026.
- Budget intent is near-universal: 92% of marketers plan to maintain or increase video spend.
- U.S. digital video ad spend has grown 31% in two years, from $54.7B to a projected $72B.
B2B Video Adoption and Budget Intent, 2024-2026
| Year | % Businesses Using Video | % Planning Same or More Spend Next Year | % Integrating Video Into Overall Strategy |
|---|---|---|---|
| 2024 | 89% | 85% | 88% |
| 2025 | 89% | 92% | 95% |
| 2026 | 91% | 92% | 93% |
Source: Wyzowl, State of Video Marketing 2025 (n=205) and 2026 (n=266).
Key Takeaways:
- Adoption rebounded to the 2023 all-time high of 91% after two flat years at 89%.
- Budget protection is near-universal: 92% of marketers plan to spend the same or more in 2026, double the 5% who plan cuts.
- Strategic integration (93%) leads adoption (91%), indicating that teams using video are increasingly building it into core strategy rather than treating it as supplemental content.
Video Adoption Trend, 2016-2026
| Year | % of Businesses Using Video | YoY Change (pp) |
|---|---|---|
| 2016 | 61% | Baseline |
| 2018 | 81% | +20 |
| 2020 | 85% | +4 |
| 2022 | 86% | +1 |
| 2023 | 91% | +5 |
| 2024 | 89% | -2 |
| 2025 | 89% | 0 |
| 2026 | 91% | +2 |
Source: Wyzowl, State of Video Marketing, 12 Years of Data (2026 report).
Key Takeaways:
- Video adoption grew 30 percentage points between 2016 and 2023, then plateaued near-universally.
- The growth phase is over. Video is now infrastructure: the remaining 9% of non-adopters are concentrated in sectors with regulatory constraints on visual content.
- The 2024-2025 dip and 2026 rebound suggest temporary cost or resource friction, not structural pullback.
B2B Video Marketing Performance and ROI
The business case for B2B video investment rests on consistently measurable returns across the funnel. Eighty-two percent of video marketers report positive ROI in 2026,1 and the conversion impact at specific touchpoints is well documented: landing pages with embedded video convert up to 86% better than text-only equivalents,5 email CTR can triple with a video thumbnail,6 and companies using video report 49% faster revenue growth than those that do not.2 The 2025-to-2026 drop in self-reported ROI from 93% to 82% is worth monitoring. It likely reflects a combination of stricter measurement standards, rising production cost benchmarks, and increased budget scrutiny as video shifts from growth investment to line-item default.
Reported ROI Metrics for B2B Video, 2026
| ROI Metric | Reported Outcome | Benchmark vs. Non-Video |
|---|---|---|
| Video marketers reporting good ROI | 82% | N/A (self-reported) |
| B2B marketers ranking video as #1 ROI content format | 52% | Outranks blog posts, infographics, case studies |
| Short-form video: % ranking it #1 ROI format | 49% | 3rd consecutive year at #1 |
| Landing page conversion lift with video | Up to 86% | vs. text-only pages |
| Revenue growth: video users vs. non-users | 49% faster | vs. no video |
| B2B sales cycle reduction with video | 27% shorter | vs. no video |
| Email CTR lift with video thumbnail or preview | Up to 300% | vs. static email |
| Email CTR lift from including 'video' in subject line | Up to 65% | vs. no mention |
| Video impact on lead generation (self-reported) | 85% say video helps generate leads | N/A |
| Video impact on direct sales increase (self-reported) | 83% say video directly increased sales | N/A |
Source: Wyzowl, State of Video 2026; Vidico/Smart Insights, 2025; HubSpot, 2026; EyeView/Hostinger, 2025; Wordstream, 2024; Vidyard Business Benchmark, 2026; Campaign Monitor, 2025.
Key Takeaways:
- 82% of video marketers report positive ROI in 2026, down from the 2025 peak of 93%, possibly reflecting stricter measurement practices or higher production cost benchmarks.
- Short-form video has ranked #1 for ROI three years running; 49% of B2B marketers name it their highest-returning content format.
- Landing pages with embedded video convert up to 86% better than text-only equivalents, the most consistently cited conversion statistic in B2B video research.
- Email video integration produces the largest single-variable CTR lift available: up to 300% with a video thumbnail, and up to 65% by adding the word 'video' to the subject line.
- Quantified business impact extends beyond engagement: video correlates with 49% faster revenue growth and a 27% shorter B2B sales cycle.
Share of Video Marketers Reporting Positive ROI, 2019-2026
| Year | % Reporting Positive ROI |
|---|---|
| 2019 | 83% |
| 2021 | 87% |
| 2023 | 87% |
| 2024 | 88% |
| 2025 | 93% |
| 2026 | 82% |
Source: Wyzowl, State of Video Marketing, historical trend data compiled in 2026 report.
Key Takeaways:
- 2025 represented the all-time high for positive ROI at 93%; 2026's reading of 82% is the largest single-year drop in Wyzowl's tracking history.
- Despite the drop, 82% remains well above the 2019 baseline of 83%, and the multi-year trend still skews positive.
- The dip may reflect rising production benchmarks, greater measurement sophistication, or increased budget scrutiny as video moves from growth channel to default line item.
B2B Video Types and Formats
Format selection is one of the highest-leverage decisions in B2B video strategy. Vidyard's analysis of nearly one million B2B videos2 shows that product demos (47% of content created) and explainers (35%) are the two most-produced dedicated formats, consistent with a buyer base that relies on video for product education and vendor evaluation. Short-form social video, defined as content under 60 seconds, now has a dedicated budget line at 57% of marketing teams5 and ranks as the top-ROI format for the third consecutive year. Completion rate data from Wistia3 and Vidyard2 confirm that format and length interact directly with viewer behavior: a video under one minute retains 65% of viewers to completion, while one over 20 minutes retains only 20%.
B2B Video Format Usage and Effectiveness, 2026
| Video Format | % of B2B Marketers Creating | Avg Completion Rate | Primary Funnel Stage |
|---|---|---|---|
| Short-form social (under 60 sec) | 57% (dedicated budget line) | 2.5x engagement vs. long-form | Awareness / Top of funnel |
| Product demo | 47% | 65% (under 1 min); drops with length | Consideration / Mid funnel |
| Explainer / animated | 35% | ~50% (educational videos under 5 min) | Awareness / Consideration |
| Recorded webinar / on-demand | 33% | Strong; holds attention better than most long-form | Consideration / Lead capture |
| How-to / tutorial | 31% | 82% (under 1 min); 50%+ (1-30 min) | Consideration / Retention |
| Customer testimonial / case study | 30%+ | ~50% (case study page benchmark) | Decision / Conversion |
| Live-action (all types, primary style) | 51% | N/A (style, not format) | All stages |
| Animated (primary style) | 23% | N/A | All stages |
| Screen recorded (primary style) | 19% | N/A | All stages |
Source: Vidyard Video in Business Benchmark Report 2025 (format share); Wyzowl State of Video 2026 (production style); Wistia State of Video 2025 (completion rates); HubSpot State of Marketing 2026 (short-form ROI and budget share).
Key Takeaways:
- Product demos (47%) and explainers (35%) are the two most-created dedicated B2B formats, confirming buyer preference for informational, evaluation-stage content.
- Short-form social video (under 60 seconds) has the widest budget adoption, with 57% of marketing teams now allocating a dedicated line item.
- Live-action remains the dominant production style at 51%, but the combined share of animated and screen-recorded (42%) reflects growing technical and SaaS-driven content needs.
- Webinars punch above their creation volume: despite being created by fewer teams than demos or explainers, they rank among the highest-impact formats for B2B lead quality.
Highest-Converting B2B Video Formats
| Video Format | Conversion Metric | Reported Conversion Rate or Lift |
|---|---|---|
| Long-form content (30-60 min) | Email or gated content conversion rate | 17% conversion rate (highest by length) |
| Webinar | Registration-to-attendance rate | 57% |
| Interactive or product video | Conversion rate lift vs. passive video | Up to 70% |
| Short-form (under 60 sec) | Engagement per impression vs. other formats | 2.5x |
| Video on landing page | Landing page conversion rate vs. text-only | Up to 86% |
| Customer testimonial video | Sales page conversion lift | Up to 34% (VWO testing) |
Source: Wistia State of Video 2025 (long-form conversion rate); ON24 Webinar Benchmarks Report 2025 (registration-to-attendance); Vidyard Business Benchmark 2025 (interactive video lift); HubSpot/Digitalapplied, 2026 (short-form engagement); EyeView/Hostinger, 2025 (landing page); Wyzowl/Trustmary (testimonial lift).
Key Takeaways:
- Long-form content (30-60 min) achieves the highest absolute conversion rate of any length tier at 17%, according to Wistia analysis.
- The 57% webinar registration-to-attendance rate is unusually high for B2B content and reflects the pre-qualified, intent-driven nature of webinar registrants.
- Interactive video (clickable CTAs, branching paths, forms) lifts conversions up to 70% over passive video, making interactivity the highest-leverage production upgrade available.
- Short-form video converts on volume: 2.5x engagement per impression makes it the strongest top-of-funnel format even when individual conversion rates are lower.
Average B2B Video Length by Type and Trend
| Video Type | Recommended Length | Completion Rate at This Length | Trend (2016-2026) |
|---|---|---|---|
| Social / awareness | Under 60 seconds | 65% (under 1 min threshold) | Avg dropping to 39 sec projected by end 2026 |
| Sales outreach | Under 60 seconds | 65% | Shortening; Vidyard recommends under 60 sec |
| Product demo | 2 minutes or under | Drops significantly past 2 min | Stable |
| Explainer / how-to | Under 5 minutes | 50%+ engagement through 1-30 min | Stable |
| Webinar / deep-dive | 30-60 minutes | 17% conversion rate at this length | Growing (420% more 20-min+ videos in 2024) |
| Overall B2B average (all types) | 76 seconds | 65% under 1 min threshold | Down from 168 sec in 2016 |
Source: Vidyard Video in Business Benchmark Report 2025 (completion rates, length benchmarks); Wistia State of Video 2025 (long-form engagement); Bynder/Sprout Social (length trend projections); Wyzowl, 2026 (sweet spot survey).
Key Takeaways:
- Average B2B video length has fallen 55% since 2016, from 168 seconds to 76 seconds, driven by platform algorithm shifts and audience attention patterns.
- The 30-second to 2-minute window is the broadest-consensus sweet spot: 71% of marketers cite this range as most effective (Wyzowl, 2026).
- Long-form is not dying: Vidyard recorded 420% growth in videos over 20 minutes in 2024, confirming that B2B teams are producing both short-form social content and long-form decision-stage assets simultaneously.
- Completion rate drops steeply with length, from 65% under 1 minute to 20% for videos over 20 minutes, making front-loading value a non-negotiable production discipline.
B2B Video Distribution Channels
Platform selection is a strategic decision, not a default. The same video distributed natively on LinkedIn will outperform the same video shared as an external link by 38% to 500% on engagement,3 because the platform's algorithm actively penalizes outbound links with up to a 60% reach reduction. YouTube remains the most widely used video marketing platform at 82% adoption1 and earns the highest effectiveness rating at 69%,1 functioning as both a search engine and a social platform for B2B audiences. LinkedIn has overtaken YouTube as the primary B2B video distribution channel by team priority: according to Wistia's 2026 report,3 8 in 10 teams identify it as their first-choice platform for sharing video.
B2B Video Channel Performance, 2026
| Channel | % B2B Marketers Using | % Rating as Most Effective | Key Performance Metric |
|---|---|---|---|
| YouTube | 82% | 69% | Most-used and highest-rated; 2.7B monthly active users |
| 70% | 50% (Wyzowl); B2B #1 by Wistia | +36% watch time YoY; native video gets 38-500% more engagement than external links | |
| 69% | 56% | Reels 60-90 sec get highest engagement on platform | |
| 66% | 55% | Engagement declining YoY; still high usage | |
| Webinar platforms | 56% | High (73% say webinars generate highest-quality B2B leads) | 57% registration-to-attendance rate |
| TikTok | 40% | Lower for B2B conversion | 200B+ daily Shorts-equivalent views; stronger for awareness than conversion |
| Widely used | 65% CTR lift (subject line) / 300% CTR lift (thumbnail) | Highest conversion-per-click lift of any channel when video is added | |
| Website / landing page | Standard practice | Up to 86% conversion rate lift | 38.6% of marketers call video the most impactful landing page element |
Source: Wyzowl State of Video 2026 (platform usage and effectiveness); Wistia State of Video 2026 (LinkedIn as #1 B2B channel); CMI/LinkedIn, 2025 (watch time growth); ON24 Webinar Benchmarks 2025; Campaign Monitor, 2025; EyeView/Hostinger, 2025; HubSpot, 2024.
Key Takeaways:
- YouTube is the dominant platform by usage (82%) and effectiveness (69%), functioning as both a search engine and a social video platform for B2B audiences.
- LinkedIn has become the #1 B2B video channel by team priority according to Wistia's 2026 data: 8 in 10 teams say it is their primary platform for sharing videos, even surpassing YouTube.
- Native LinkedIn video uploads outperform external links by 38-500% engagement, making direct uploads a non-negotiable distribution practice.
- Webinars generate the highest-quality leads of any format: 73% of B2B marketers confirm this, with a 57% registration-to-attendance rate and leads that cost significantly less than paid channels.
- Email is the highest-leverage single-variable conversion channel: adding a video thumbnail can triple CTR, and simply mentioning 'video' in the subject line lifts CTR by up to 65%.
Fastest-Growing B2B Video Channels, 2025-2026
| Channel | YoY Growth Metric | Why It Matters for B2B |
|---|---|---|
| LinkedIn video | +36% watch time YoY | Decision-makers consume video during work hours; algorithm penalizes outbound links by up to 60% reach reduction, making native upload essential |
| Connected TV (CTV) | +35% ad spend YoY | B2B brands using CTV for ABM and demand gen; 56% of marketers globally plan to increase CTV spend |
| YouTube Shorts | 70B to 200B daily views | Short-form SEO and discovery channel expanding rapidly; 5.91% engagement rate, highest of any short-form platform |
| Webinar / virtual event platforms | Stable with strong engagement | 57% registration-to-attendance rate; on-demand replays drive plays for up to 12 months post-event |
Source: CMI/LinkedIn, 2025; IAB Digital Video Ad Spend Report 2025; Nielsen, 2025; YouTube/Cannes Lions, 2025; SocialInsider LinkedIn Benchmarks, 2026; ON24 Webinar Benchmarks, 2025.
Key Takeaways:
- LinkedIn's algorithmic prioritization of native video makes it the highest-ROI B2B channel for organic reach, particularly for decision-maker audiences.
- CTV is transitioning from an experimental brand awareness channel into a standard performance and ABM tool, growing at 35% annually on ad spend.
- YouTube Shorts' engagement rate of 5.91% is the highest of any short-form platform, outpacing TikTok and Reels on a per-view basis.
- Webinar on-demand content compounds in value over time: Wistia data shows replays continue generating plays for up to 12 months after the live event.
B2B Video Budget and Production Trends
Video budget intent remains strong despite tightening marketing spend across many B2B sectors. Ninety-two percent of video marketers plan to maintain or increase their video investment in 2026,1 and U.S. digital video ad spend is projected to reach $72B, a 31% increase from 2024.4 The more significant shift is in production economics. AI tools have reduced the median cost per finished minute of video from $4,200 to $2,500 over two years,3 but total video spend is rising regardless, because teams are reinvesting the savings into higher production volume rather than reducing budgets. The teams producing the most video in 2026 are not the ones with the largest budgets. They are the ones that have built efficient in-house capabilities and supplemented them with AI tools for scripting, captioning, and pre-production planning.
B2B Video Budget and Spend Trend, 2024-2026
| Metric | 2024 | 2025 | 2026 |
|---|---|---|---|
| % Marketers planning same or more video spend | 85% | 92% | 92% |
| % B2B marketing teams expecting video budget increase | 57% (Wistia) | 48% planning increase | 40% planning increase (Wistia, 2026) |
| U.S. digital video ad spend | $54.7B | $64B | $72B (projected) |
| Global digital video ad spend (Statista) | $173.5B | $191.4B | $223.5B (projected) |
| % Marketers spending on video ads (of all video marketers) | 36% | 41% | 41% |
| Most common per-video production budget | Under $5,000 | Under $5,000 | Under $5,000 |
| Median production cost per finished minute | $4,200 | $3,500 (AI beginning to compress) | $2,500 (AI-driven reduction) |
| % Videos produced primarily in-house | ~75% | ~75% | ~75% |
| % Videos outsourced exclusively | ~25% | ~25% (outsourcing up 7% YoY per Wistia) | ~25% (hybrid growing) |
Source: Wyzowl State of Video 2025 and 2026; Wistia State of Video 2025 and 2026; IAB Digital Video Ad Spend Report 2025; Statista digital video advertising 2026; Digitalapplied, 2026.
Key Takeaways:
- Despite a slight decline in teams actively increasing budgets (from 57% in 2024 to 40% in 2026 per Wistia), overall spend intent remains high: only 5-10% of teams are cutting video budgets.
- AI tools have cut median production cost per finished minute by 40%, from $4,200 to $2,500, without proportionally reducing output volume.
- U.S. digital video ad spend has grown 31% in two years; the global market is on track to exceed $223.5B in 2026.
- 41% of video marketers are now running paid video ads, up from 36% two years prior, signaling maturation from organic-only into full-funnel video investment.
AI in B2B Video Production, 2024-2026
| AI Video Metric | 2024 | 2025 | 2026 |
|---|---|---|---|
| % Video marketers using AI tools for creation or editing | 18% | 41% | 63% |
| % Marketing teams using AI video in at least one campaign per quarter | ~30% | ~78% | ~78%+ |
| AI video generator market size | $614.8M | $716.8M-$788.5M | $847M-$946.4M (projected) |
| Production cost reduction from AI tools | Minimal | Up to 40% | 40%+ vs. 2024 baseline |
| % AI tool users primarily using for pre-production (scripting, ideation) | N/A | Majority | Most common use (ChatGPT for planning) |
| % AI tool users planning to use AI captions | N/A | 60%+ | 90% of teams adding accessibility features |
| % Consumers saying AI content lowers brand perception | N/A | N/A | More than 33% |
Source: Wyzowl State of Video 2026; Wistia State of Video 2025 and 2026; DemandSage AI video generator market data; Digitalapplied, 2026; HubSpot, 2026 (consumer perception).
Key Takeaways:
- AI adoption in video production tripled in two years, from 18% to 63%, the fastest adoption curve of any marketing production technology tracked by Wyzowl.
- Pre-production is the most common AI use case: teams primarily use tools like ChatGPT for scripting, planning, and ideation before production begins.
- The cost paradox: AI has cut production costs 40%, but total video spend continues to rise as teams reinvest savings into higher production volume rather than reducing budgets.
- Consumer perception risk is real: more than a third of consumers say AI-generated content would lower their perception of a brand, making human creative oversight essential for high-stakes B2B content.
In-House vs. Outsourced Production Split, 2024-2026
| Production Approach | 2024 | 2025 | 2026 |
|---|---|---|---|
| Primarily in-house | ~75% | ~75% | ~75% |
| Outsourced to freelancers or agencies | ~25% | ~25% (outsourcing up 7% YoY) | ~25% (both in-house and outsourced rising) |
| Primary in-house driver | Cost and control | AI tools reducing complexity | AI tools + compliance with new accessibility laws |
| Primary outsourcing use case | High-stakes brand and campaign video | Complex productions, brand films | Same; hybrid norm emerging |
Source: Wistia State of Video 2025 (14M videos, 1,300-person survey) and 2026 (13M videos, 900-person survey); Wyzowl State of Video 2025 and 2026.
Key Takeaways:
- In-house production has held steady at roughly 75% for three consecutive years, indicating that the shift to internal production is complete rather than still accelerating.
- Outsourcing is not declining: Wistia recorded a 7% YoY increase in outsourced production in 2025, suggesting teams are scaling both in-house and external production simultaneously.
- The hybrid model is the emerging norm: blended teams handling routine content internally while outsourcing high-stakes brand and campaign video to specialist agencies.
- AI tools are the primary driver of in-house capability expansion, compressing skills gaps and reducing the need for specialist technical knowledge at the production level.
B2B Video Marketing Statistics: Looking Forward
The 2026 data tells a consistent story across all five dimensions. Video adoption has reached a near-universal ceiling at 91%,1 ROI is strong and well-documented across formats and channels, AI is accelerating production volume while compressing costs, and B2B buyers rely on video at every stage of the purchase process.2 The competitive question is no longer whether to invest in video: it is whether the video a team produces is precise enough in format, long enough in the right places, short enough everywhere else, and distributed on the right platforms with the right native upload practices to reach decision-makers before competitors do. For organizations presenting high-consideration products, including large-format display technology and AV systems, the visual quality and production clarity of that content increasingly determines whether it earns attention and moves a buyer toward a conversation.
See MicroLED Video Quality for Yourself
Video content is only as persuasive as the display it plays on. The data in this report shows that 89% of consumers say video quality directly impacts their trust in a brand. For B2B teams presenting products, services, or data to clients and decision-makers, the screen matters as much as the content itself.
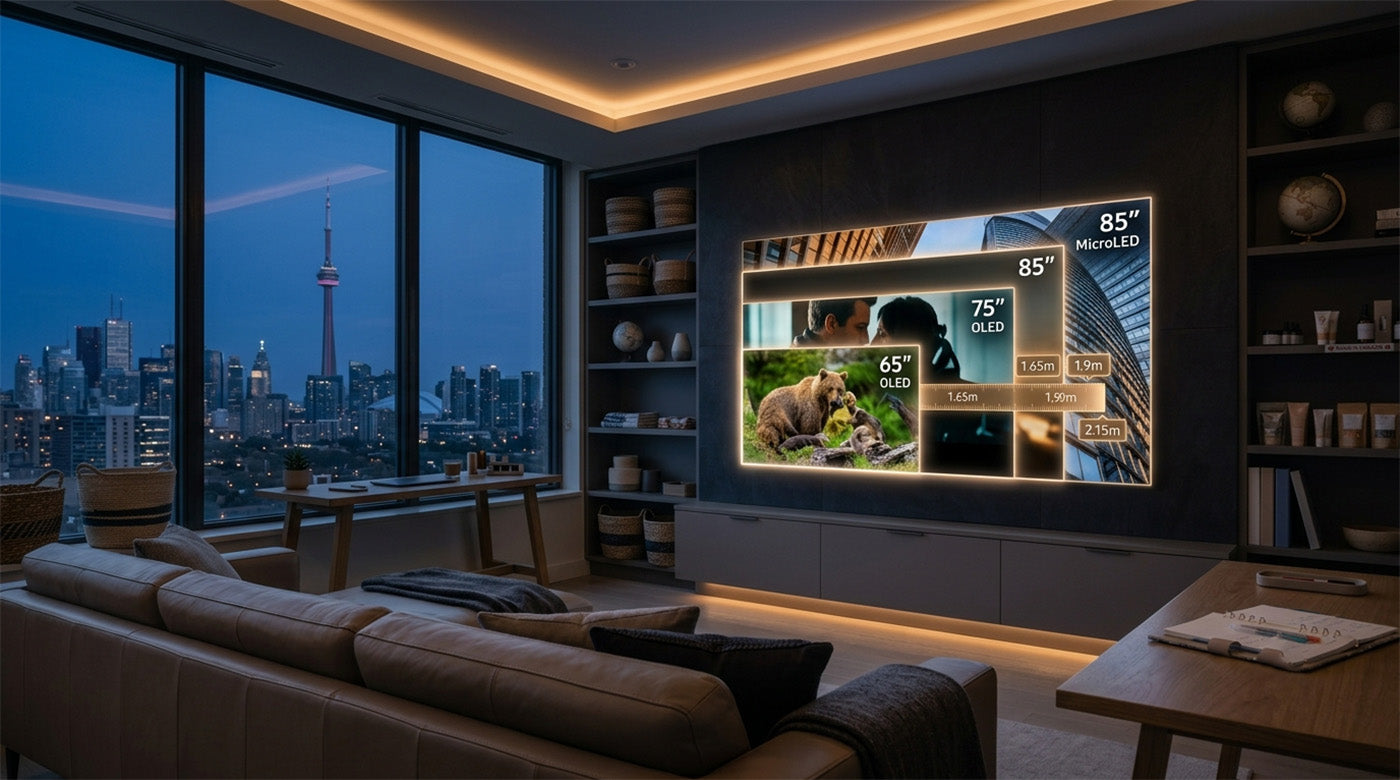
AWALL’s C-Series and Phoenix displays are built for exactly this context. The C-Series delivers 1,200 nits peak brightness, a 15,000:1 native contrast ratio, and Flip-Chip Chip-on-Board (CoB) MicroLED technology across seven sizes from 75” to 162”, starting at $19,250. The Phoenix is a 135” all-in-one motorized MicroLED display with an internal processor at $46,750, recognized with Best of Show honors at both InfoComm 2025 and CEDIA 2025.
Both are priced transparently at awall.com, the only MicroLED manufacturer that publishes pricing online rather than requiring a quote. Call +1 (800) 455-1450 or visit awall.com to see specs, compare sizes, and order direct.
References
1 Wyzowl. State of Video Marketing 2026. wyzowl.com/video-marketing-statistics/ (Survey of 266 marketing professionals, conducted late 2025.)
2 Vidyard. Video in Business Benchmark Report 2025. vidyard.com/business-video-benchmarks/ (Analysis of 940,000+ B2B videos.)
3 Wistia. State of Video 2025 and 2026. wistia.com/learn/marketing/video-marketing-statistics (2025: 14M videos, 100K businesses, 1,300-person survey. 2026: 13M videos, 900-person survey.)
4 IAB. Digital Video Ad Spend and Strategy Report 2025. https://www.iab.com/insights/video-ad-spend-report-2025/
5 HubSpot. State of Marketing 2026. hubspot.com/marketing-statistics
6 Campaign Monitor. What Is the Average Click-Through Rate from Videos? campaignmonitor.com/resources/knowledge-base/what-is-the-average-ctr-from-videos/
Confirmed Sources
| # | Source Name | URL | Relevant Data | Date |
|---|---|---|---|---|
| 1 | Wyzowl, State of Video Marketing 2026 | wyzowl.com/video-marketing-statistics/ | Adoption (91%), ROI (82%), budget intent (92%), platform data, AI adoption (63%), in-house production (59%), format breakdown | 2026 (survey conducted late 2025, n=266) |
| 2 | Wistia, State of Video 2025 and 2026 | wistia.com/learn/marketing/video-marketing-statistics | AI adoption (18% to 41% YoY in 2025; 35%+ in 2026), in-house vs. outsourced production split (~75% in-house, ~25% outsourced), production budget data, format performance | 2025 (14M videos, 100K businesses, 1,300-person survey); 2026 (13M videos, 900-person survey) |
| 3 | Vidyard, Video in Business Benchmark Report 2025 | vidyard.com/business-video-benchmarks/ | B2B video completion rates (65% under 1 min, 20% over 20 min), average B2B video length trend, format breakdown (demos 47%, explainers 35%), nearly 1M videos analyzed | 2025 |
| 4 | IAB, Digital Video Ad Spend and Strategy Report 2025 | iab.com | U.S. digital video ad spend ($64B in 2024, projected $72B in 2025), digital video share of total TV/video ad spend (60%), CTV growth | 2025 |
| 5 | HubSpot, State of Marketing 2026 | hubspot.com/marketing-statistics | Short-form video ROI leadership (49% of B2B marketers rank it #1), landing page conversion data, email video CTR impact | 2026 |
| 6 | Campaign Monitor, Video in Email | campaignmonitor.com/resources/knowledge-base/what-is-the-average-ctr-from-videos/ | Email CTR lift with video: up to 65% lift (including 'video' in subject line) and up to 300% lift (video thumbnail/preview vs. static email) | 2022, widely cited through 2025 |

Leave a comment
This site is protected by hCaptcha and the hCaptcha Privacy Policy and Terms of Service apply.